
Project Overview
This project was conducted solely by myself during my internship at ByteDance, with data and pictures faked as well as the company's permission to put in my portfolio and copyright protected.
Project Background
In the primary stage of the international e-commerce development, livestream related e-commerce accounts for most GMV(Gross Merchandise Value), being the important business scene. However, since it is not mature enough, merchants need the help from the operators to guide and supervise their livestream performances.
The Pearl platform is the platform for the operators for local, merchant and creators. These operators are responsible for helping the local and cross-border merchants to improve their livestream performance on Tiktok. When merchant encounter issues concerned with livestream, such as unknown rule violation and sudden traffic decline, they seek for help from the operators, who also help them find problems and seek improvements.
How can we help operators view livestream performance details efficiently?
User:
Operators
Scene:
Data presentation of key Live rooms
Design Objective:
Easy and efficient to view data

Research
After the product manager presented me with the project background and requirements, I did some research.
Internal document: I went through internal documents to learn the business background and product strategy. I also learned the key matrixes, terminologies and formulas.
Competitive analysis: I researched various websites that are platforms for e-commerce performance in both mainland and cross borders, including Shopify, Chamama, Alimama, Douyin etc.. , on their user flow and data presentation logistics and structures.
Ideation
I first developed a user journey map in the following for how the user might seek problems and improvements from the livestream performance data.
Based on the user flow chart, I developed the wireframe below for the web pages' basic information structure.
I also made a mind map which summarizes each tab's provided data.
Design & Iterations
Tab1: Data Overview
01 Challenge
The PM asked me to put over 10 data indicators on each 4 modules.
Miller’s Law: around 7 pieces of information.
Too much data -> easily overwhelmed.
02 Attempted Solutions
1. Module in a row
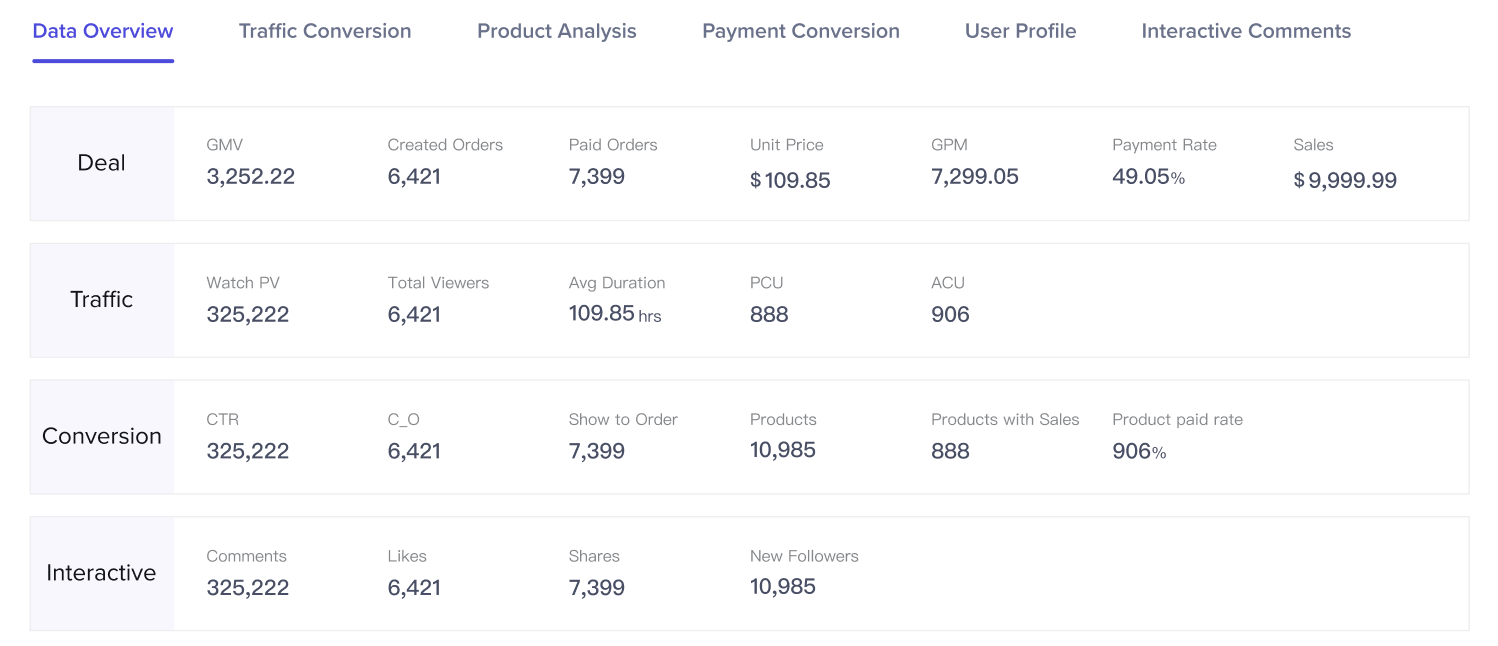
Pro: Flexible in rows for more data modules
Con: Low screen efficiency; not aligned - X
So I changed the pattern to 4 * 4, displaying only 4 by each module.
2. Four indicators/Four Modules
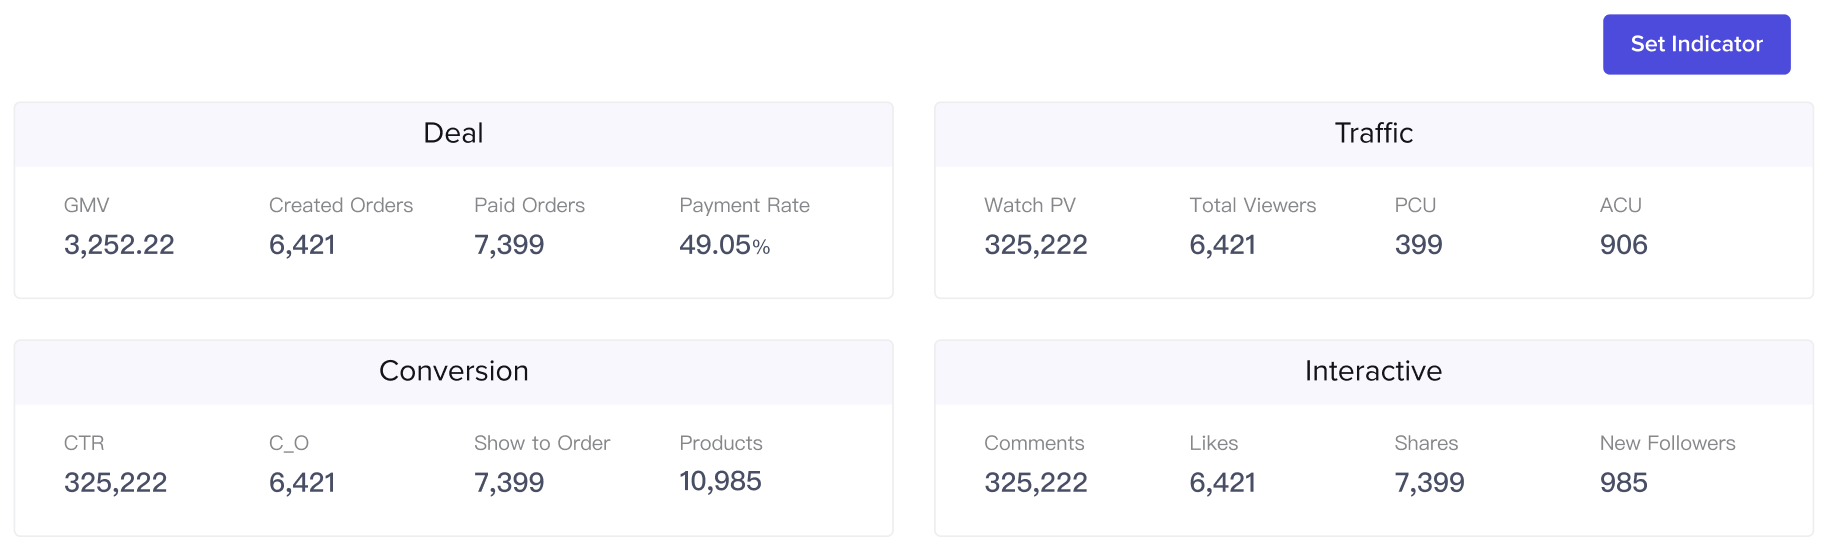
How to display the rest of the data?
2.1 “Set Indicators”
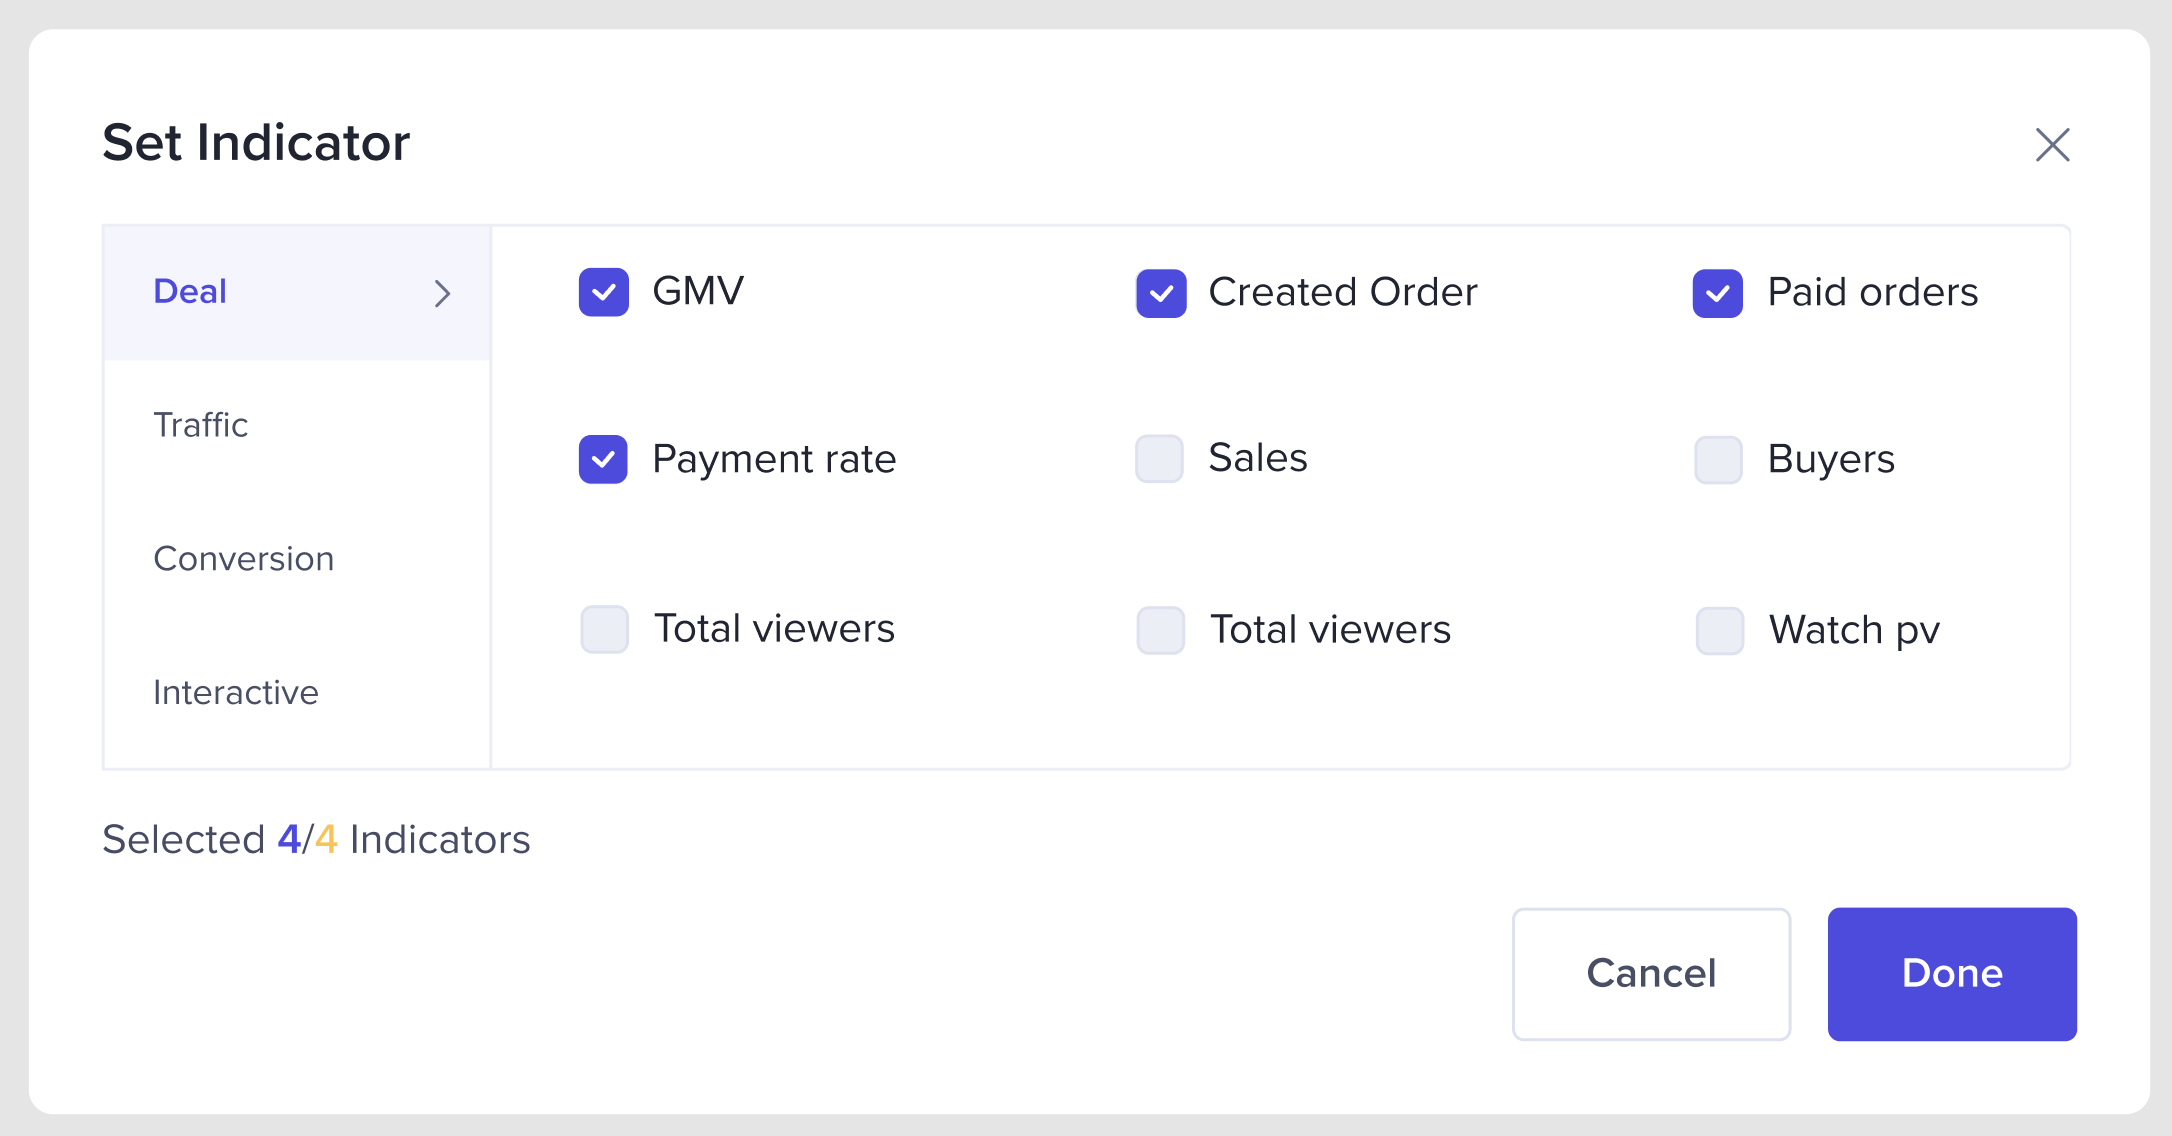
Con: click the button ”set indicator” is costly - X
2.2 “Show more”
Con: click the button beneath is costly and hard to find - X
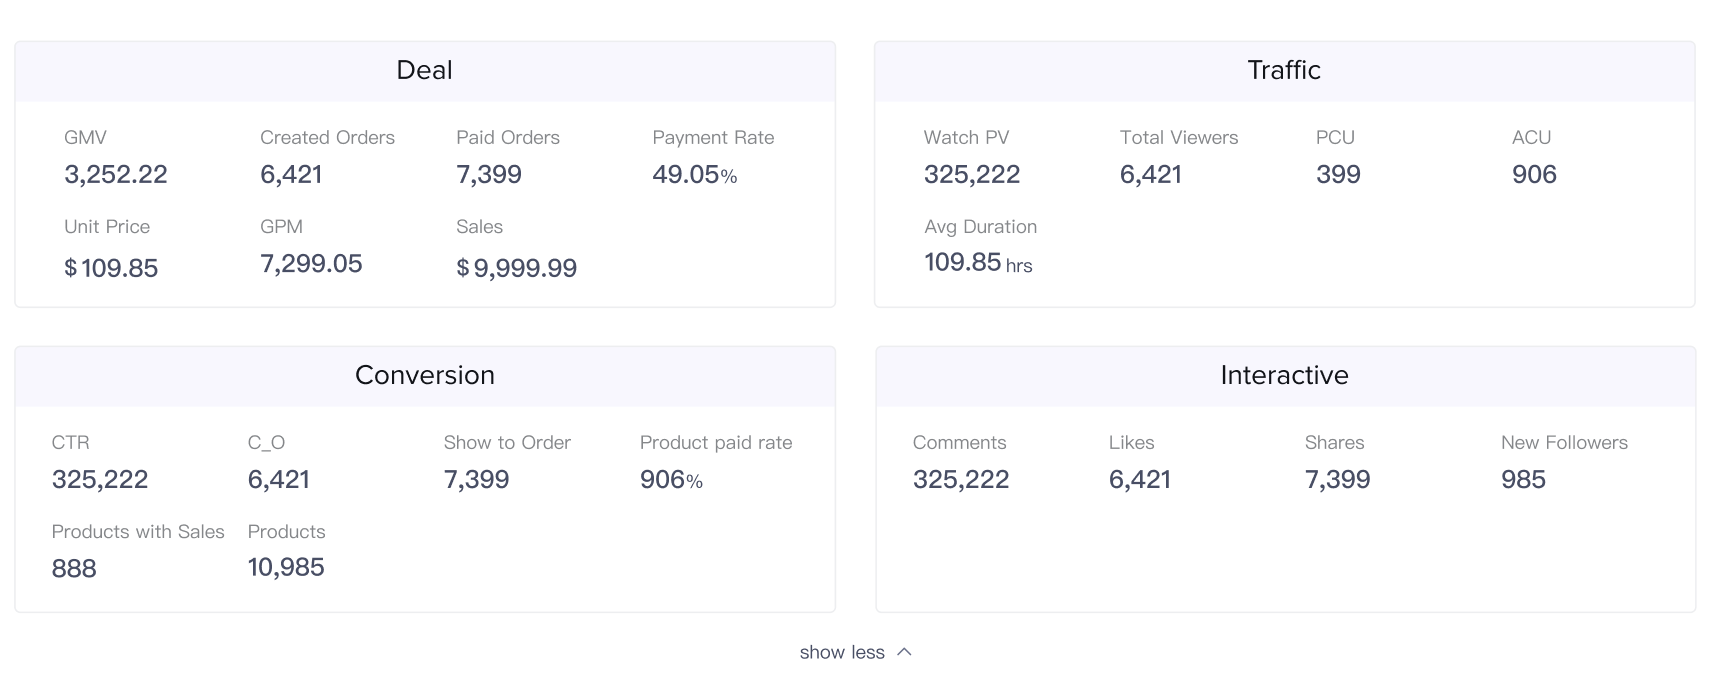
Why don’t we just showcase all at one time?
Data priority? Stressed by Fonts.
03 Final Decision
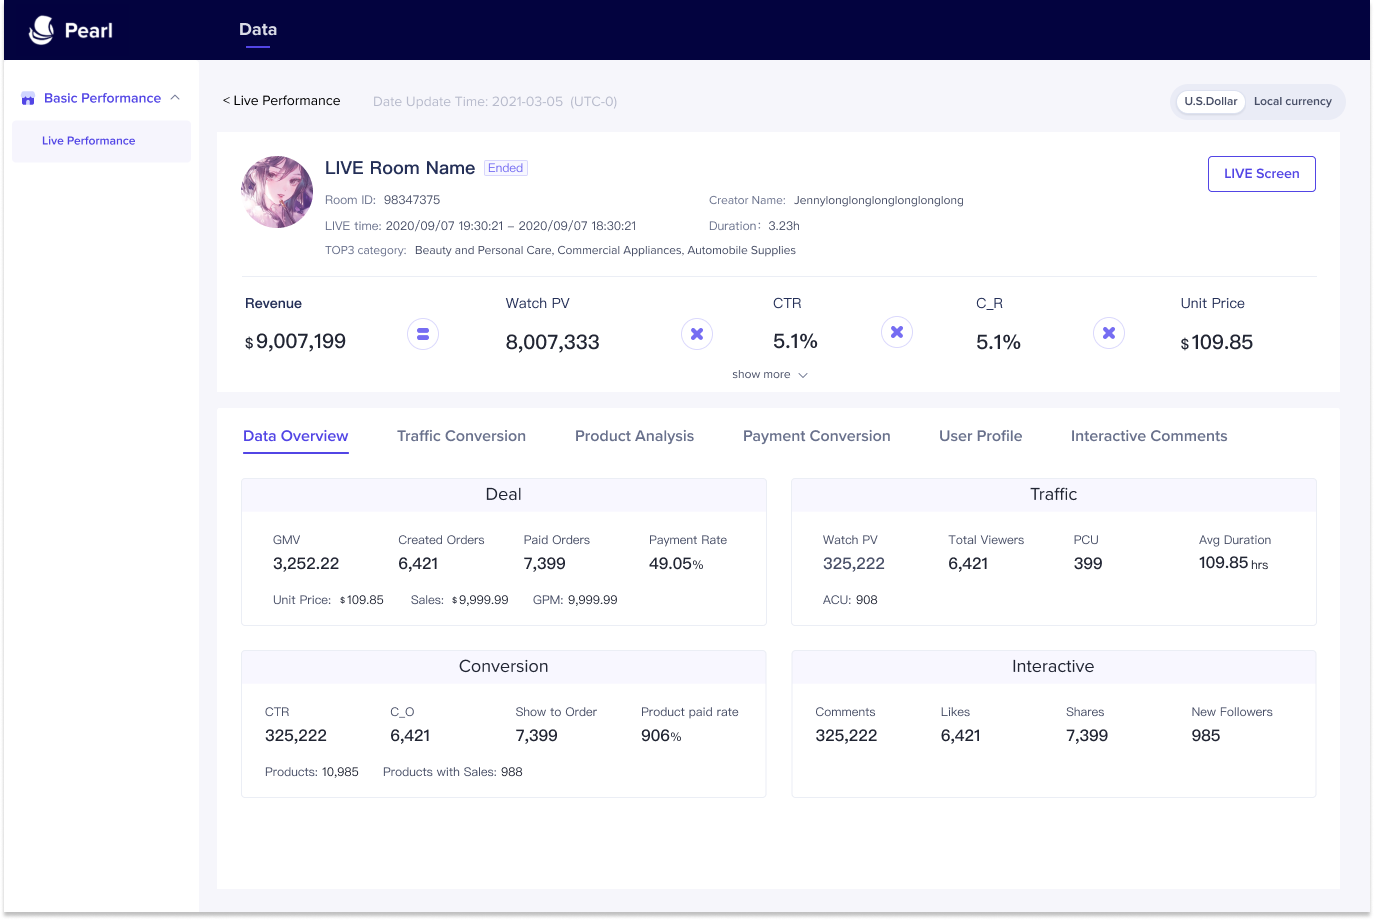
Pro:
1. Neat: as displayed in 4 modules
2. Efficient: no need to click, display all
3. Data Priority: stress critical data pieces in heavier fonts and form
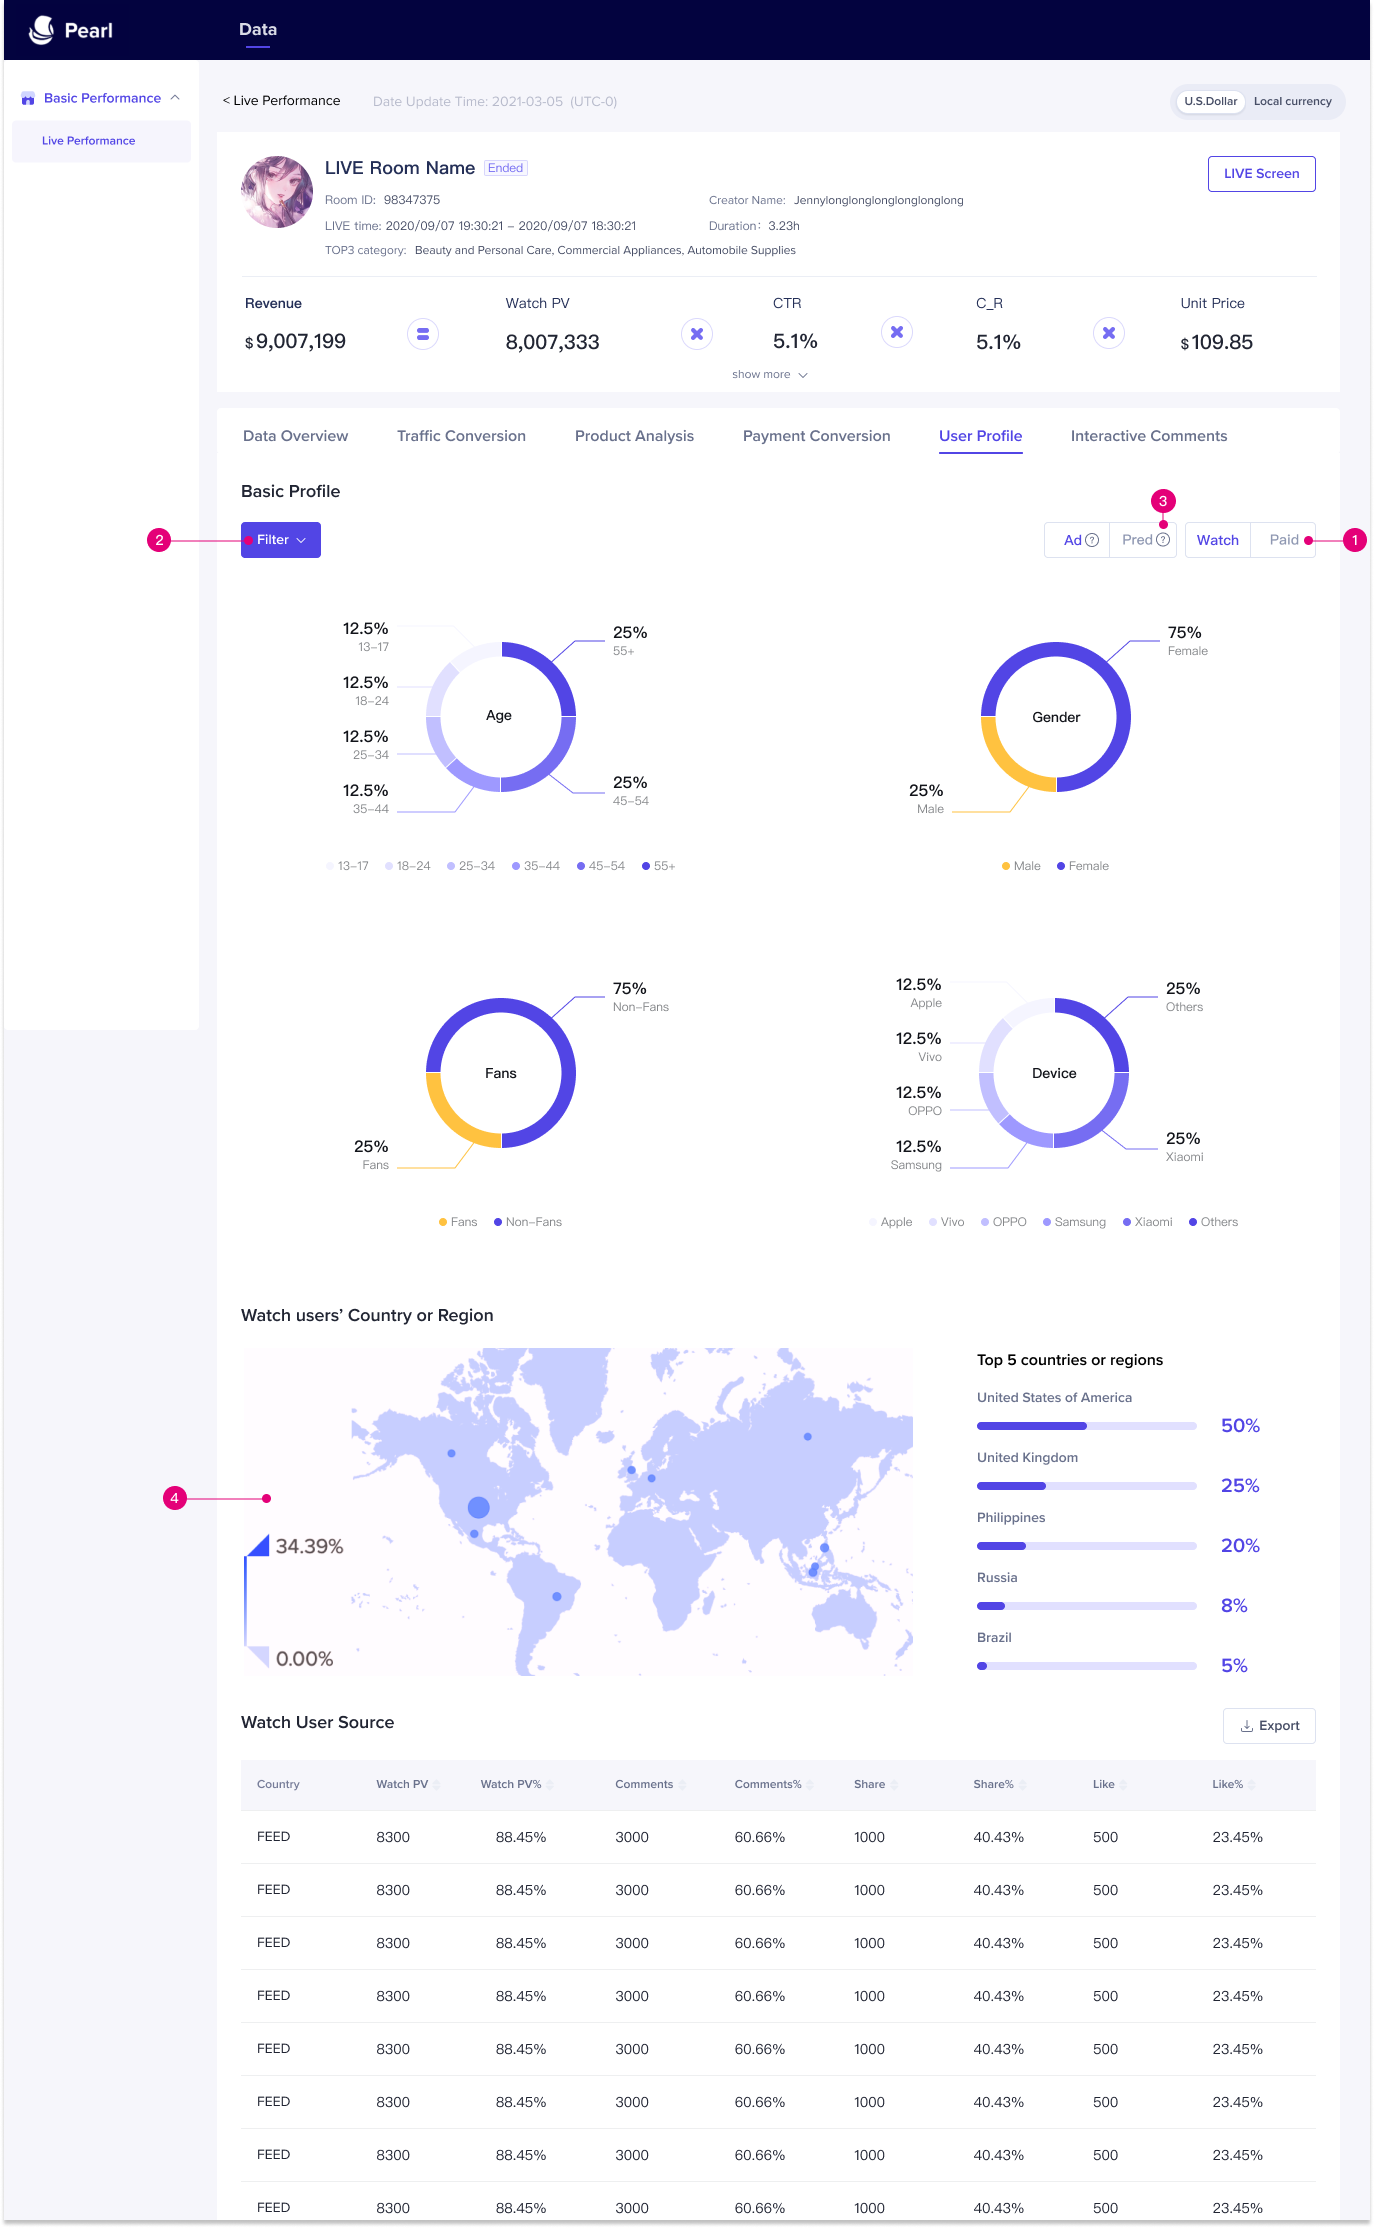
Tab5: User Profile
01 Challenge
Filter the user profiles by each group.
Indicate what has been filtered.
02 Attempted Solutions
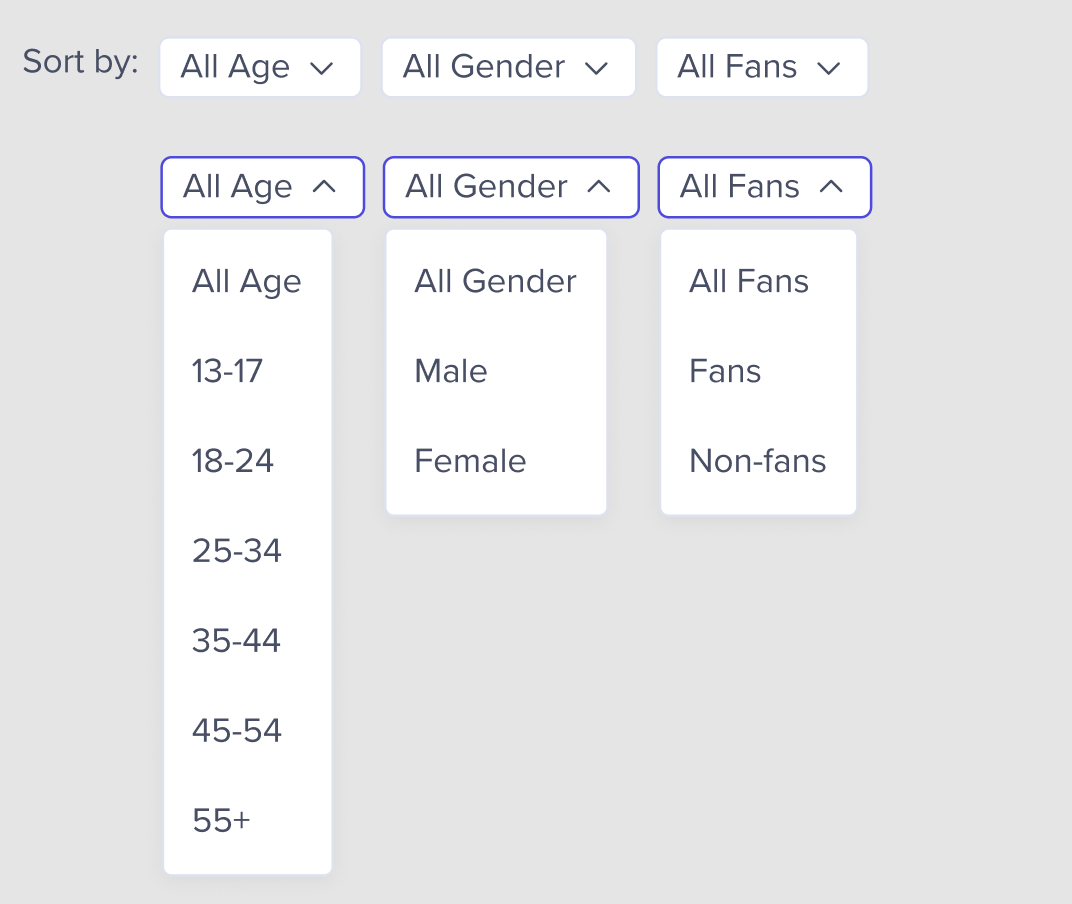
1. Cascader 2. Dropdown
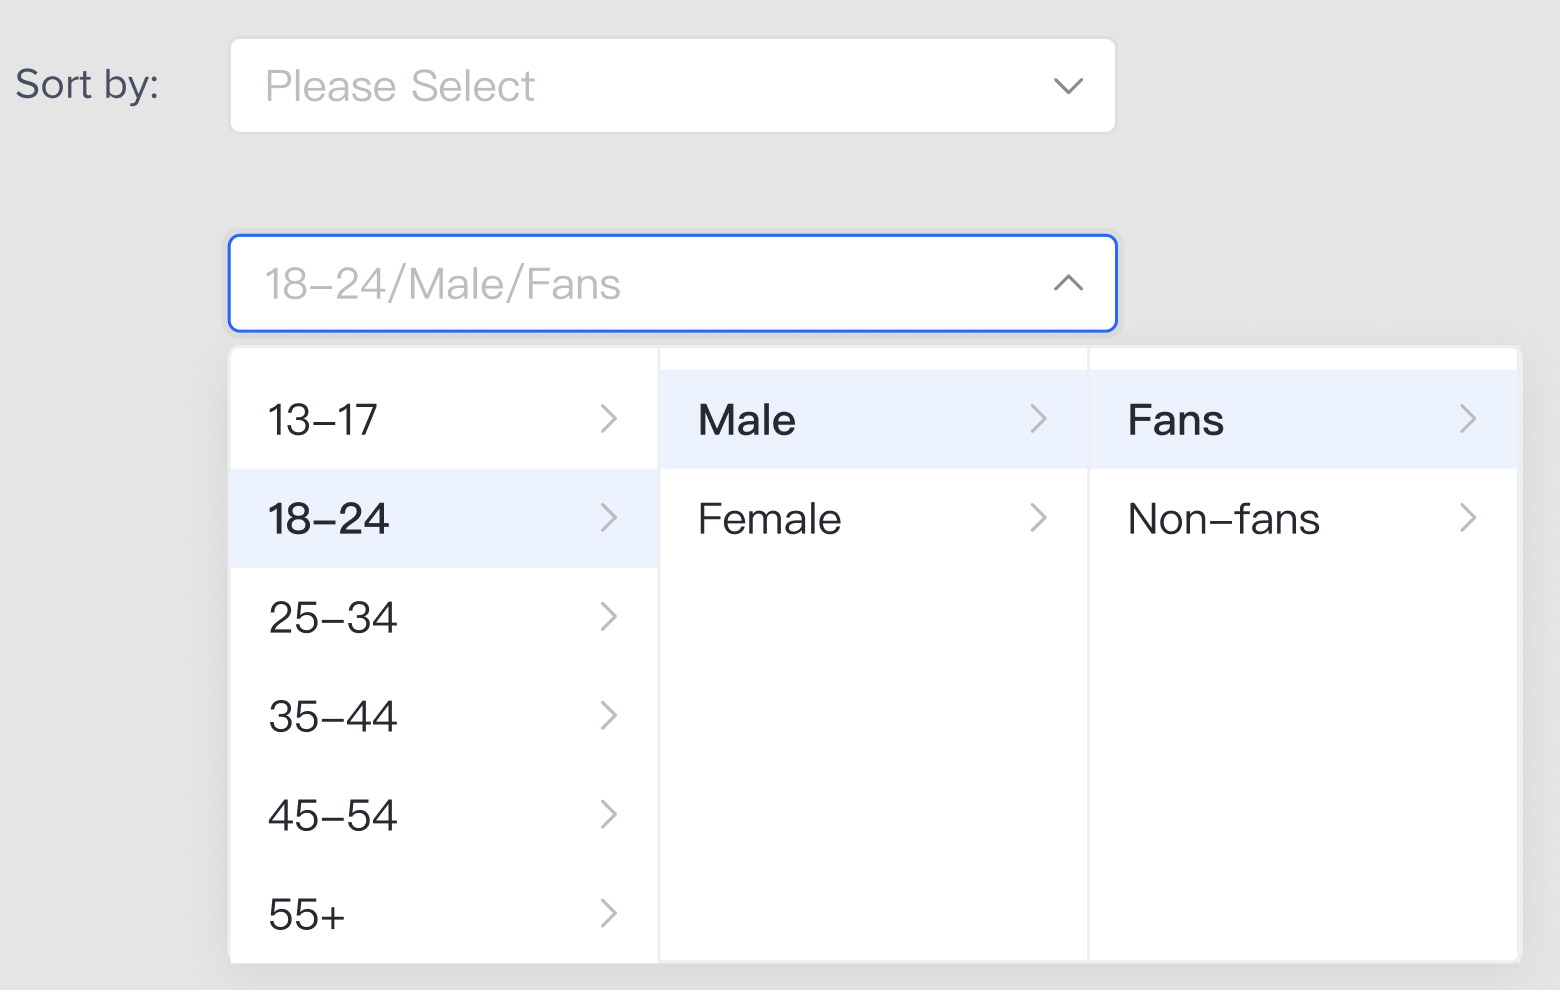
Con: one designated route - X
Pro: easy to use, know what to filter
Con: one designated route of filtering,
ignored other filter buttons - X
03 Final Decision
1. “Filter” button 2. Multiple filters
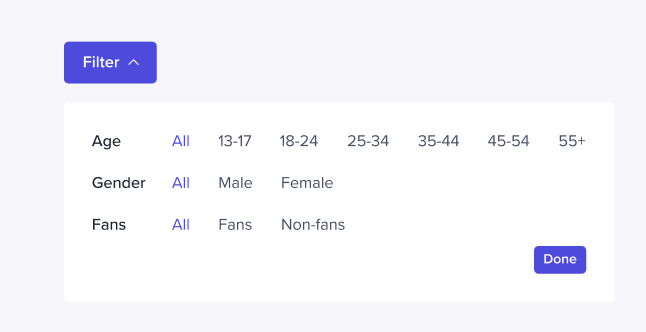
Fast: filter by multiple dimensions at once
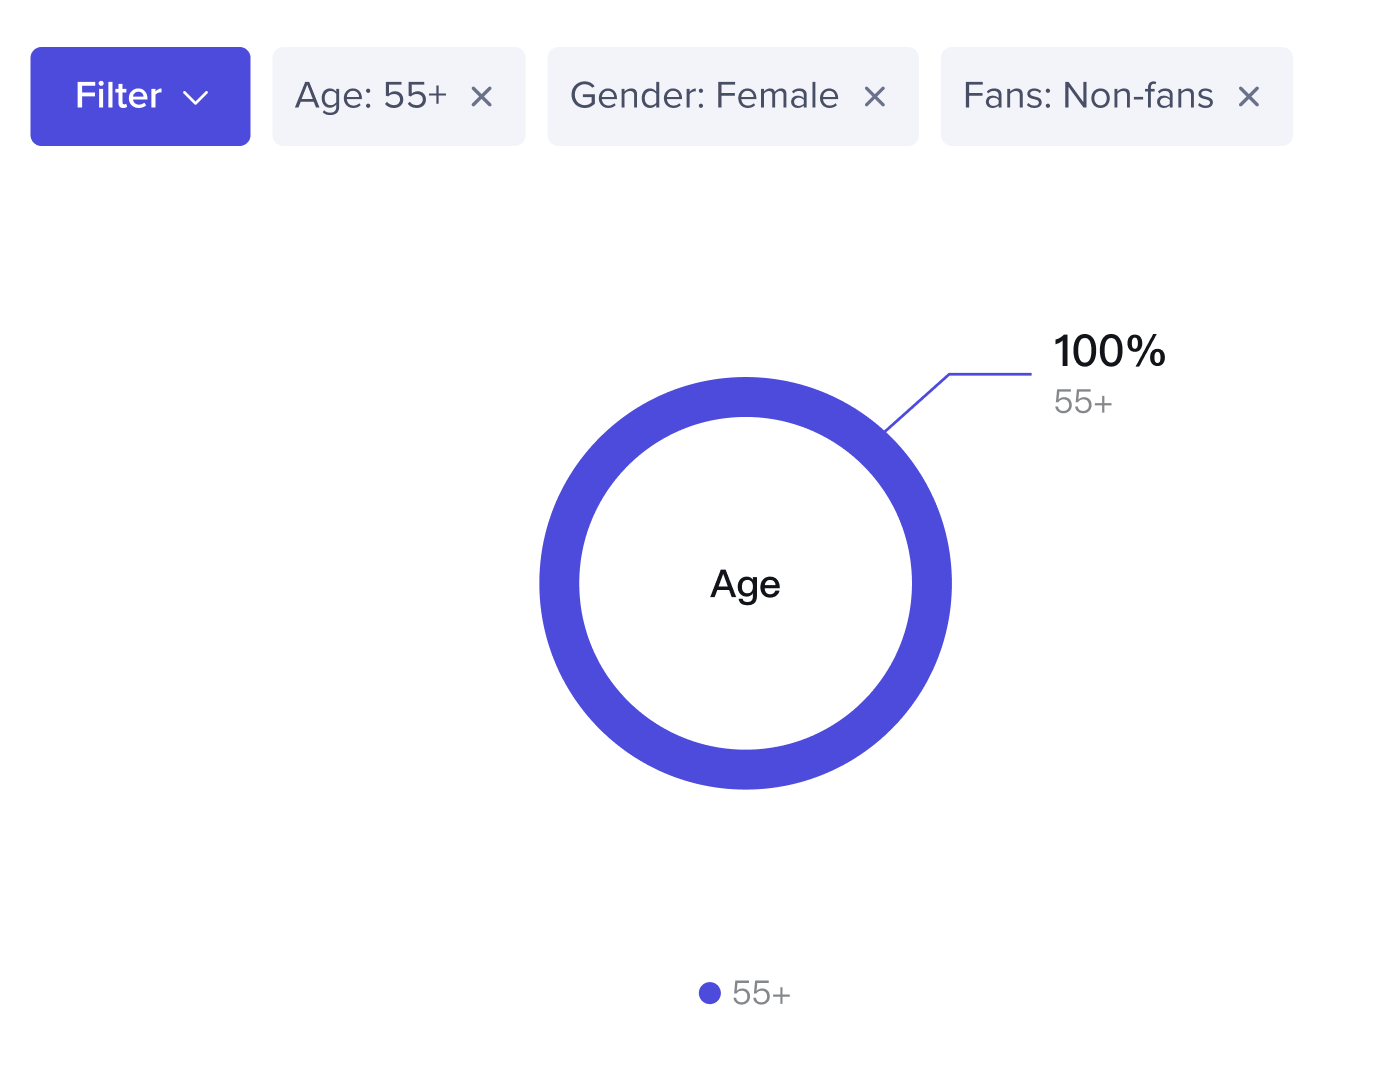
Clear: display what has been filtered
- Filtered tags next to the “Filter” button
- Click “X” on the filter tag to cancel filtering of this category

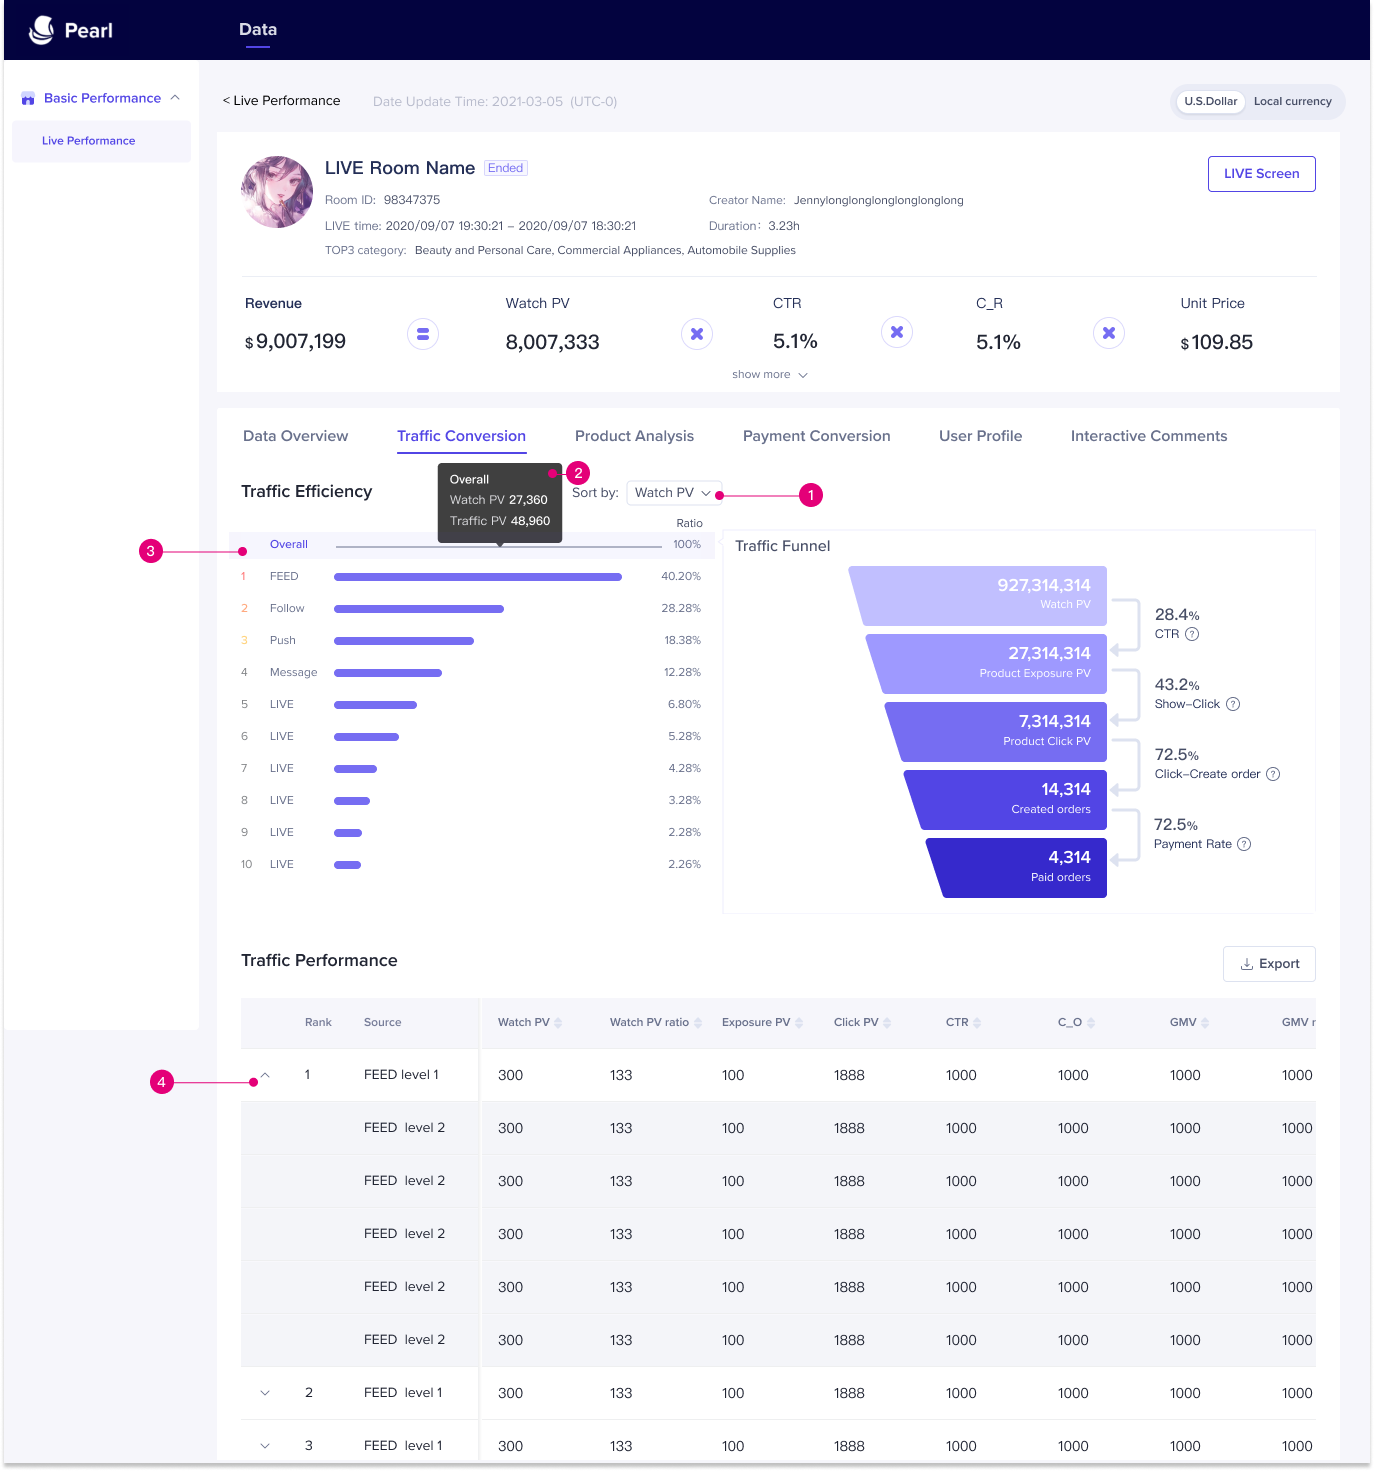
Other Tabs: their innovations
Tab 2: Traffic Conversion

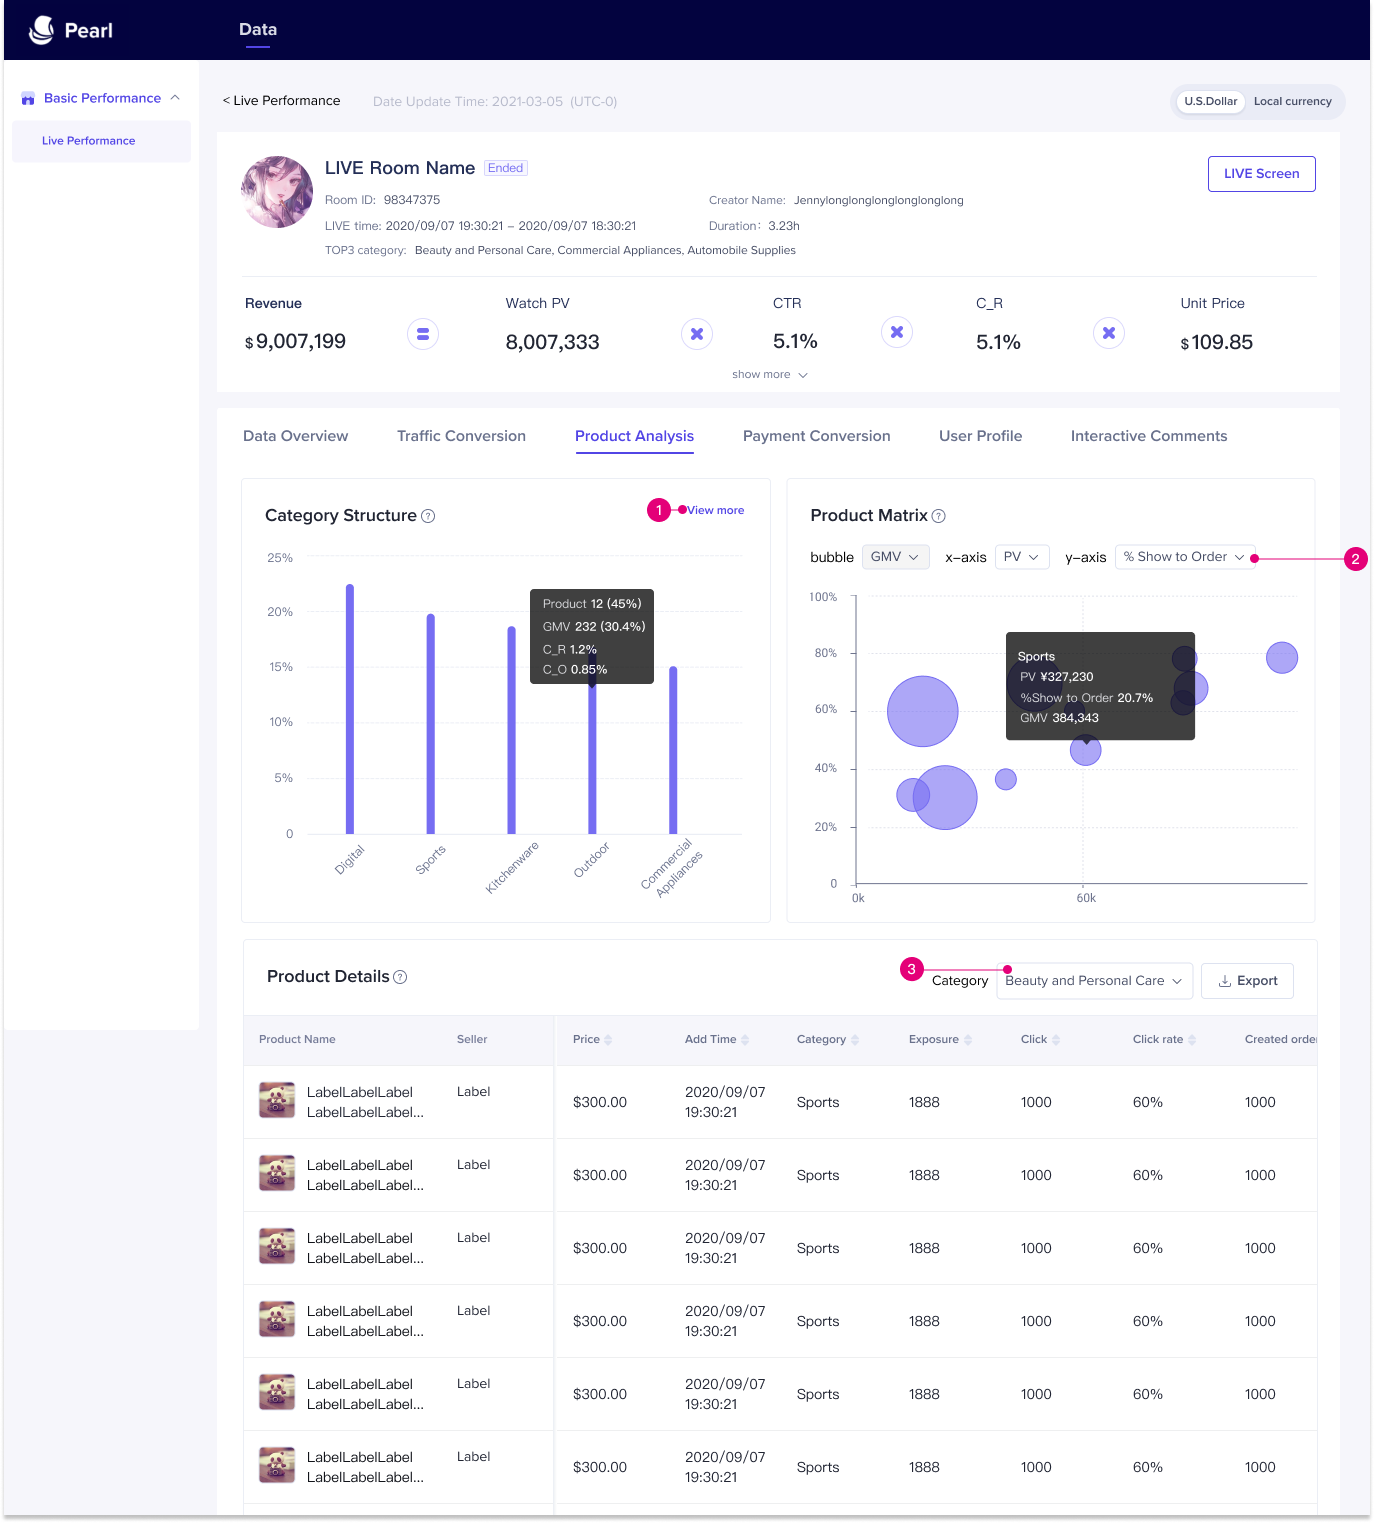
Tab 3: Product Analysis

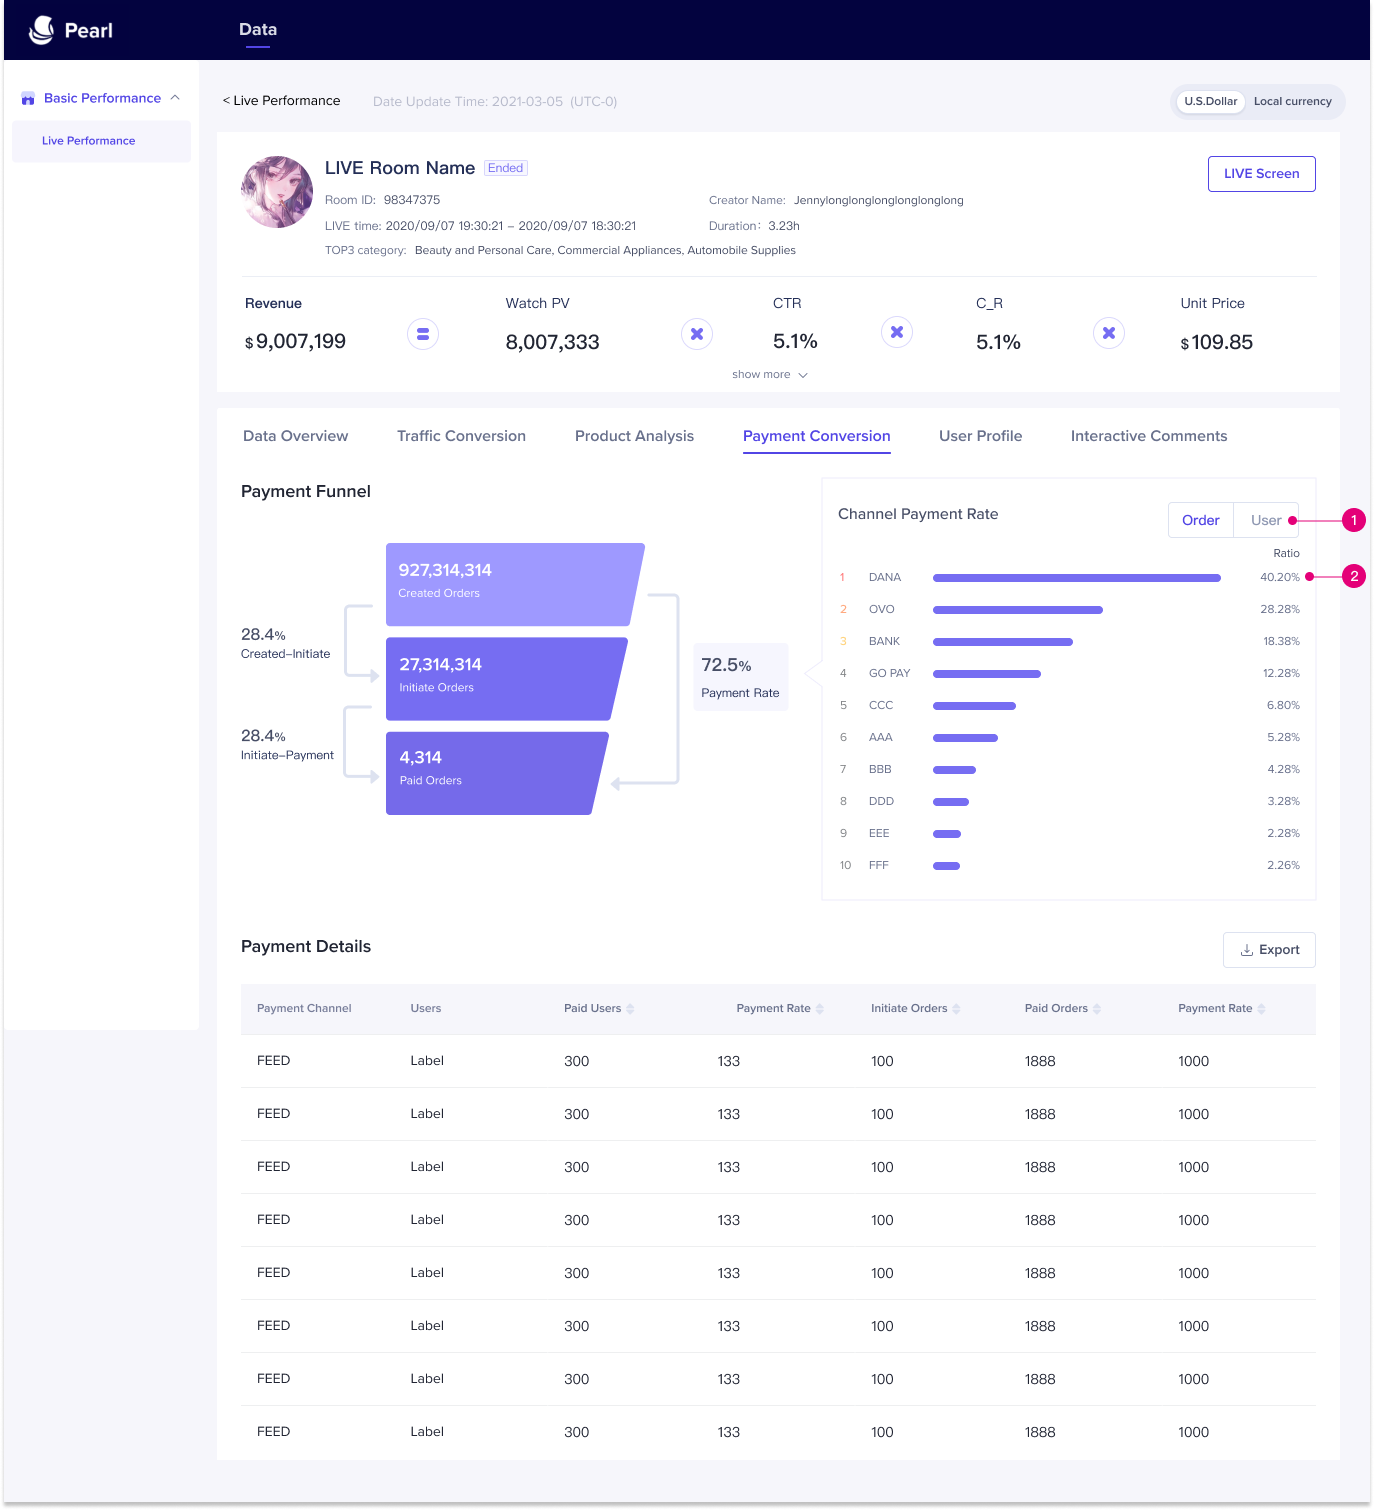
Tab 4: Payment Conversion

Reflection
This project presents revenue-related metrics for merchant operators to identify problems, seek improvements, and make data-driven decisions in livestream performances.
Through iterations, many design decisions were made. Reasons behind decisions involved the knowledge of cognitive psychology(tab1), users' working route(tab5), and other innovations in the interaction.
In the next version of this project, data analysis tools were added and 6 pages were cut down into 3 pages(only about viewer, content, and product) for operators to obtain in-depth analysis in major crucial areas.